![]()
Upgrades for all MAHA Chassis Dynamometers
e.g.
Maha LPS 13,
Maha LPS 2000, ASM ( Snap On, Sun Electric)
Sun Ram 12, Sun Ram XII, Sun Ram XI, Sun Ram 11
also available for SUN (RAM Road-a-Matic)
and BOSCH LPS 002, LPS 95-to LPS 99, also Bosch FLA 202 / Bosch FLA 203 / Bosch FLA 206) (for FLA see link: Bosch FLA)
also suits Hofmann Dynatest / 112
![]()
| -
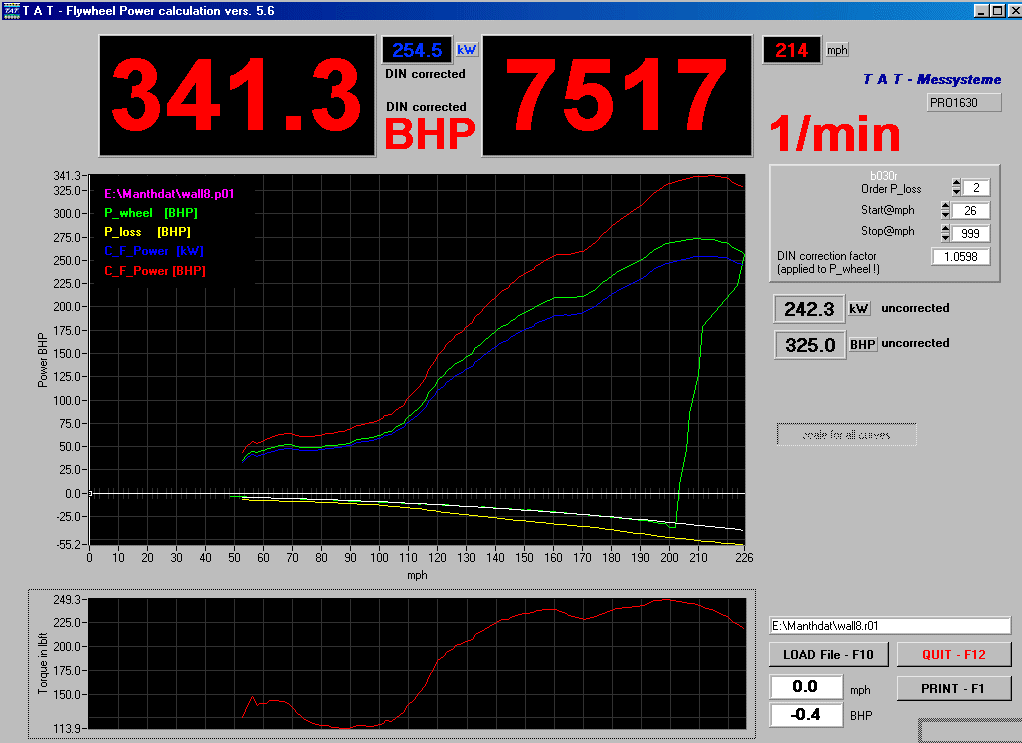
all data is stored on a PC - all data can be made avaialable via networking - all sensor values are displayed in real-time during a dyno run - Graphs of Power and Torque - Power and Torque corrected to SAE, EWG (EEC), DIN, etc. - all data can be viewed on screen in the form of curves or in tabular format - graph print-outs in full colour of graphs and data table - ample space for comments for each individual dyno run - overlaying of all curves out of multiple tests possible - acquisition of Power at the wheels and the Power losses in the drivetrain during coast-down - calculation of true corrected Flywheel Power, even for older systems (see picture 5) as the sum of the corrected power at the wheels and the power losses in the drivetrain - connection of nearly any sensor or instrument possible: e.g. pressures: boost pressure, exhaust back-pressure, oil pressure, temperatures: exhaust gas temperatures, inlet air temperatures, oil and water temp., other temperatures, air / fuel ratio, turbo speed, fuel flow, air flow, etc. - many more possibilities exist. - calculation of complex data derived from input data, such as BSFC, BSAC, piston speed, or even air / fuel ratio directly as a function of the volatge of the vehicle's O� probe - live engine data from the engine management system can be acquired when using suitable interface electronics
|
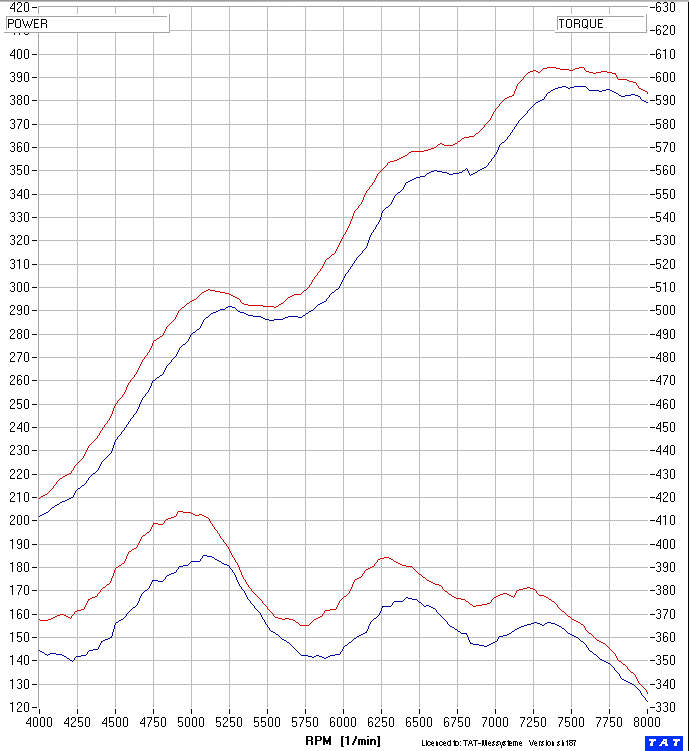
 Porsche 996 twin turbo, 680 Hp, 592 lbft on a Maha LPS-2000 with Data Acquisition by T A T - Messysteme
|
 |
Porsche 996 GT3 on a Maha LPS-2000 with Data Acquisition by T A T - Messysteme |
Click the picture to Download a SOFTWARE DEMO
Download Demo
-->
 <-- Download Demo
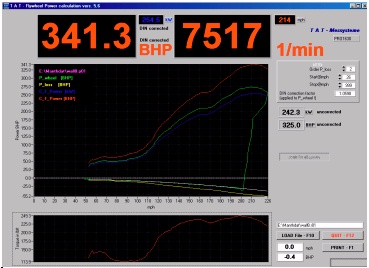
(A) pictured is the calculation of corrected engine flywheel power and engine torque

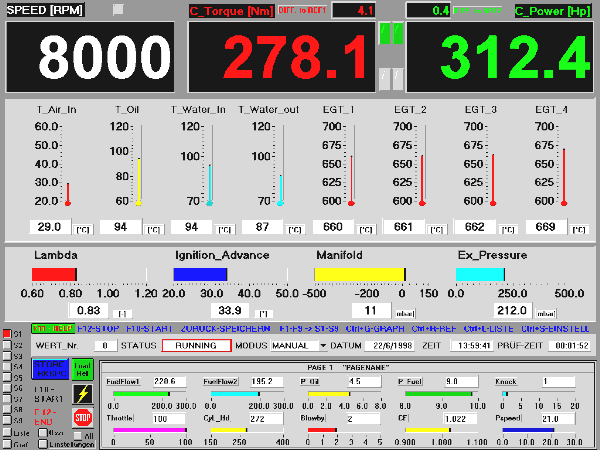
(B) pictured is the real-time on-screen display on which all readings are constantly displayed
Available languages: German and English
Available units: any units, Hp, kW, PS, Nm, lbft, psi, inchHG, mph, km/h, m/s, etc.
Power Correction standard: any standard, SAE, DIN, EEC, or own definition
Possible Sensors: all virtual on-screen instruments are user-definable regarding their screen position, name, scaling, calculation formulae etc.
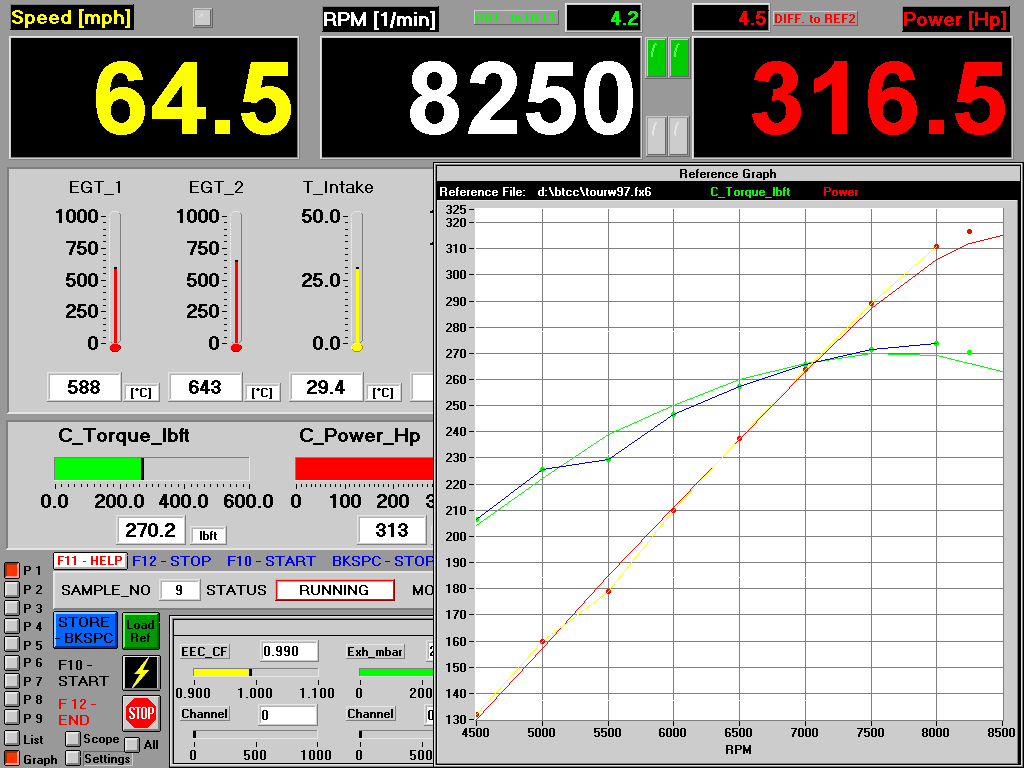
(C) above real-time graph can be displayed and viewed together with all sensor readings
Using this, engine mapping can be performed quickly, accuartely very and efficiently as a direct comparison to a baseline power curve can be made during an engine run. Consequences of changes to an engine's map can now immediately be seen easily DURING THE ENGINE BEING TESTED so a lot of time can be saved. In addition, optimum settings can be found quickly.
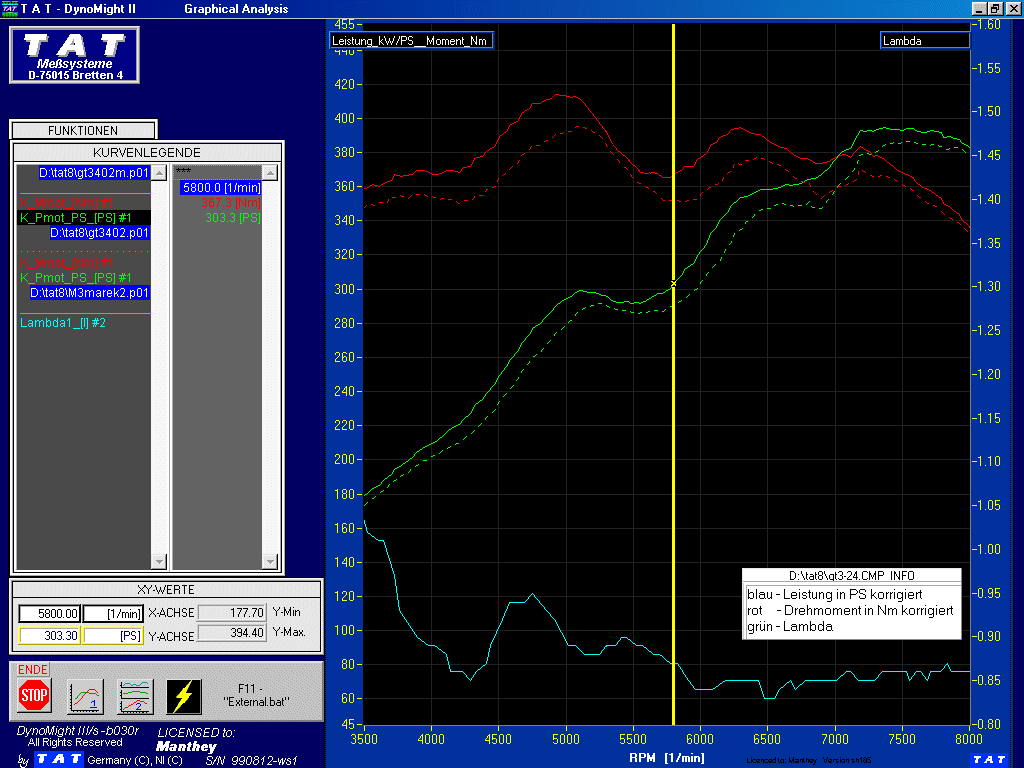
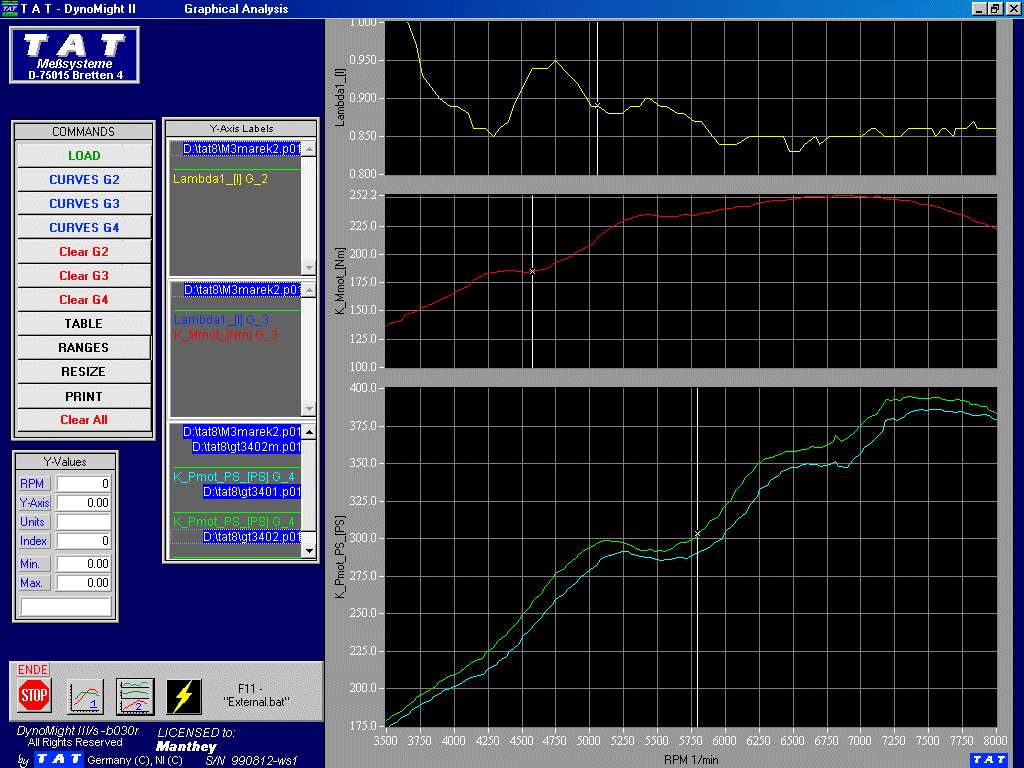
(D) The TAT graphical data presentations software offers a myriad of possibilities to view, analyze and print data.
All data can be printed on A4 paper as it is shown on-screen, so it is a true WYSIWYG software (what-you-see-is-what-you-get).
The presentation using three individual graphs is helpful when dealing with a number of readings which each require different scaling.

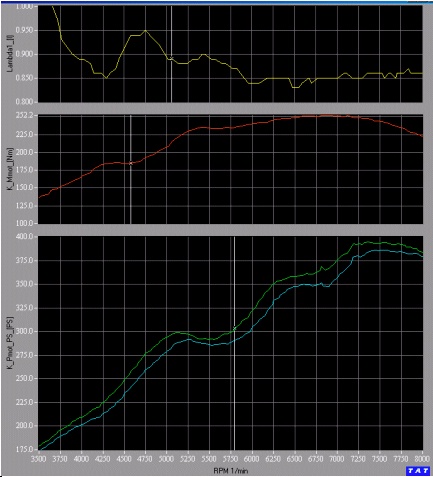
(E) For viewing and printing Power and Torque the large and easy-to-use large graph which the TAT System also offers is ideal.
In the above example you can see Engine Flywheel Power (red), Engine Torque (green) and Lambda (blue).
Lambda is assigned to the right hand scale. Please note that the scaling here is set to a narrow band of 0,7 to 1,0. This is the reason why the lambda curve seems to vary so wildly. This is the right setting for the engine tuner to see exactly what is going on. For the end-customer you can and may want to have the curve seem more flat by changing the scaling - this is of course possible.
 comments
header on every printout
comments
header on every printout
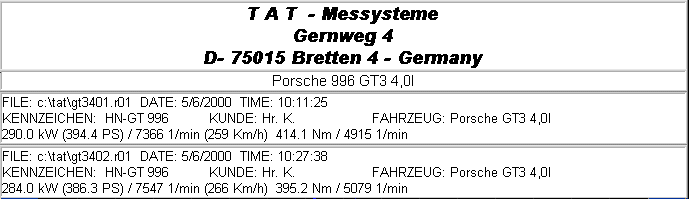
(F) This is an example of a many of how a printout can look. At the top of every printout is a header section which includes user comments, file name, and maximum power and torque figures and at which engine speed they occured. Above example shows power and torque of two test files overlayed. Up to 8 data files can be loaded and all curves out of these can be overlayed, it does not matter out of how many curves a data file consists, i.e. say if you wanted to compare Engine Power and turbo boost out of 8 tests at once you could do so.
--> Main Page <--
--> Return to previous Info Page <--
|
TAT - Messysteme
Gernweg 4 •
75015 Bretten • GERMANY Please we send a reply to every e-mail - if you receive no reply we did not receive your e-mail ! |
all links: --> (for a SITEMAP click here)
Sun/MahaDyno ASM_Dyno
InertiaDynoInfoPage
TAT-Electronics Pro-System-Info On-Board-Dyno IndustrialApplications
FLA 202 / FLA 203 / FLA 206
DemoSlideShow
Pictures of TAT equipped Dynos
TAT at the Races About_us
www.Stuska.com
www.Rollingroad.de www.TAT-RD.de
www.dynosystems.de
www.dynamometerdata.com
www.maha-lps.de
www.sunram.de
www.leistungs-pruefstand.de
www.rollingroad.org
www.chassisdyno.net
www.chassisdyno.de
www.chassisdyno.com
www.chassisdynamometer.de
www.tat-rd.com
www.tatdyno.com